
Osteoporosis CT


 |  |  |  |
|---|---|---|---|
 |
For professional use only. Osteoporosis CT provides adjunct quantitative information derived from user-selected image regions and user-supplied calibration/reference data. It does not independently diagnose osteoporosis or another disease, does not generate a DXA T-score, does not determine treatment, and does not replace radiologist interpretation, validated densitometry, fracture-risk assessment, manufacturer instructions, local quality assurance, or clinical judgment. Calibration and reference values are valid only within their documented scanner, protocol, software, anatomical site, phantom, certificate, and validation envelope.

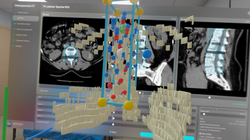


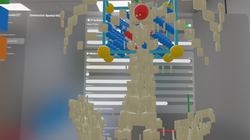


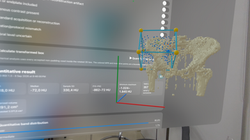
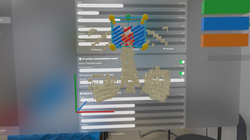


OSTEOPOROSIS CT
HOW TO PERFORM VERTEBRAL TRABECULAR CT ATTENUATION SCREENING
Method: OCT-HU-ROI 1.0
Application version: 2.2.0 (Build 22)
IMPORTANT TERMINOLOGY
Osteoporosis CT does not directly “measure osteoporosis.” It measures attenuation, in Hounsfield units (HU), inside a manually selected vertebral trabecular region of interest (ROI) on a CT examination. The HU result can support opportunistic bone-health screening when the acquisition protocol, vertebral level, anatomy, and published or locally validated method are appropriate. It does not calculate a DXA T-score and does not establish a diagnosis of osteoporosis or osteopenia.
INTENDED USER
The workflow is intended for qualified healthcare professionals familiar with cross-sectional anatomy, CT acquisition and reconstruction, DICOM metadata, artifacts, osteoporosis assessment, and the limitations of opportunistic CT attenuation.
BEFORE STARTING
1. Confirm that you are authorised to process the selected examination and that the device and exported files are handled according to institutional privacy policy.
2. Use a diagnostic CT series that can be reconstructed into Hounsfield units. The application currently decodes supported native, uncompressed monochrome CT Pixel Data. Unsupported compressed/encapsulated series are identified rather than silently interpreted.
3. Prefer an axial standard or soft-tissue reconstruction for attenuation screening. Sharp bone kernels can change measured values.
4. Review tube voltage, contrast phase, reconstruction kernel, slice thickness, reconstruction increment, pixel spacing, image completeness, geometry warnings, and any adaptive volume sampling.
5. Identify the vertebral level on multiplanar images. L1 is preferred when it is included and suitable because the default screening limits are primarily associated with published L1 methods.
6. Do not measure through a fractured, collapsed, treated, instrumented, lesional, severely sclerotic, or otherwise non-representative vertebral body.
STEP-BY-STEP WORKFLOW
STEP 1 — IMPORT THE CT
Open DICOM Library/Cases. Import:
• one DICOM file;
• multiple DICOM files;
• a folder containing a CT series; or
• a ZIP archive containing DICOM files.
The application copies selected data into its protected local workspace. Review the import audit, selected series, transfer-syntax status, number of slices, series description, protocol information, geometry status, and recommendation label. Load the suitable series as a CT volume.
STEP 2 — CONFIRM LEVEL AND SERIES
Open the Viewer or MPR & ROI workspace. Inspect axial, sagittal, and coronal images. Confirm the vertebral level and select L1 when available and valid. Confirm that the selected series is not merely a localizer, reformatted secondary capture, unsuitable sharp reconstruction, incomplete stack, or series with inconsistent geometry.
STEP 3 — SET THE CT WINDOW
Use Bone, Soft Tissue, Lung, or Custom window/level as needed to see the cortex, endplates, venous channels, focal abnormalities, and homogeneous central cancellous bone. Window/level affects display only. It does not change the stored HU values used for calculation.
STEP 4 — CHOOSE “PLACE ROI”
The Viewer separates measurement placement from navigation:
• Place ROI: tap or drag the concentric pointer. Pan and zoom are disabled in this mode so the placement gesture does not compete with image navigation.
• Navigate: pinch to zoom and drag to pan. The committed ROI remains fixed to the image.
• Reset View: restores fitted zoom and pan. A full-image double-tap reset is intentionally not used because competing gesture recognisers can cause delayed or failed touches.
STEP 5 — USE THE CONCENTRIC-CIRCLE POINTER
The pointer has three visual components:
1. Crosshair and centre dot — identify the intended centre.
2. Small concentric rings — make the centre visible against bright or dark anatomy.
3. Large translucent boundary — shows the physical surface of the ROI.
The crosshair and small rings are positioning aids. They are not themselves the measured surface.
Tap or drag until the crosshair is in homogeneous central trabecular bone. Release the gesture to commit the centre.
STEP 6 — VERIFY THE RESIDUAL ROI SURFACE
During active placement, the outer ROI is a dashed yellow circle or ellipse. After release it becomes a solid cyan residual circle or ellipse. This persistent cyan boundary is the area scheduled for measurement.
The ROI can appear elliptical on screen when effective DICOM pixel spacing differs between the horizontal and vertical axes. It still represents the requested circular area in physical millimetres.
The residual ROI should remain completely inside cancellous bone. Reposition it if it includes:
• cortical shell;
• superior or inferior endplate;
• osteophyte or vertebral margin;
• basivertebral/posterior venous plexus;
• focal sclerosis;
• hemangioma;
• lytic or blastic lesion;
• fracture or collapse;
• cement or hardware;
• motion, beam-hardening, metal, or partial-volume artifact.
STEP 7 — SELECT AREA AND SLICE SAMPLING
The default requested area is 200 mm². The corresponding physical radius is:
radius in mm = square root(requested area in mm² / π)
For 200 mm², the radius is approximately 7.98 mm.
The application converts this physical radius to loaded-image pixel radii:
radiusX in pixels = radius in mm / effective pixel spacing X
radiusY in pixels = radius in mm / effective pixel spacing Y
The default sampling uses three axial slices separated by three loaded slices. Change area, slice count, or interval only under a defined local protocol. The interface reports the approximate interval in millimetres.
STEP 8 — CALCULATE
Select Calculate HU. The application evaluates pixels whose centres fall inside the physically scaled ROI:
((x + 0.5 − centreX) / radiusX)²
+
((y + 0.5 − centreY) / radiusY)²
≤ 1
Stored DICOM values are converted to HU by:
HU = stored pixel value × Rescale Slope + Rescale Intercept
Pixels matching the DICOM Pixel Padding Value or Pixel Padding Range Limit, after rescaling, are excluded.
The same X/Y ROI is sampled on the scheduled axial indices. Indices outside the loaded volume are clamped and duplicates are removed.
STEP 9 — REVIEW THE RESULT
Review all of the following, not only the mean:
• pooled mean HU;
• median HU;
• sample standard deviation;
• minimum and maximum HU;
• 10th and 90th percentiles;
• per-slice mean HU;
• pooled non-padding voxel count;
• excluded padding count;
• requested physical area;
• rasterised measured area;
• ROI centre;
• central and sampled slice indices;
• effective pixel spacing and slice increment;
• scanner, tube voltage, kernel, slice thickness, contrast tag;
• volume sampling summary;
• DICOM provenance fingerprint;
• geometry warnings;
• screening thresholds and protocol caveats.
A large discrepancy among per-slice means may indicate anatomy change, artifact, pathology, partial-volume contamination, or inconsistent placement and should prompt visual reinspection.
STEP 10 — VERIFY THE RESIDUAL ROI
Return to the Viewer. The solid cyan residual ROI is restored when the current result matches the loaded CT provenance. Confirm it against the source image before accepting or exporting the result.
INTERPRETATION
The default configurable limits are 110 HU and 160 HU. In the study by Pickhardt and colleagues using L1 attenuation, 160 HU was used as a high-sensitivity threshold and 110 HU as a high-specificity threshold for osteoporosis relative to DXA in the studied cohort. These values are screening aids, not universal diagnostic cutoffs.
Interpretation must consider:
• vertebral level;
• contrast phase;
• tube voltage;
• scanner calibration;
• reconstruction kernel and iterative reconstruction;
• slice thickness and partial volume;
• patient anatomy and pathology;
• local validation and population;
• clinical risk factors and prior fragility fracture.
An attenuation value above a screening limit does not exclude osteoporosis. A low value does not by itself establish the diagnosis or determine treatment.
WHEN TO REJECT, REPEAT, OR QUALIFY A MEASUREMENT
Reject, reposition, repeat, or clearly qualify the measurement when:
• the ROI is not fully within representative trabecular bone;
• level identification is uncertain;
• the vertebra is fractured, collapsed, treated, instrumented, lesional, or severely sclerotic;
• the series is incomplete or geometrically inconsistent;
• the reconstruction is unsuitable for the chosen reference method;
• contrast phase is not supported by a validated local method;
• acquisition parameters are outside the locally validated range;
• too few non-padding pixels remain;
• the ROI lies partly outside the image;
• the result cannot be reproduced using the same level, series, centre, area, slice interval, and protocol.
EXPORTS
PDF provides a human-readable report. JSON and CSV provide structured audit/research data. Excel (.xlsx) contains Measurement, Per Slice, Method, and Data Dictionary worksheets.
Exports include the measurement, method version, requested and rasterised area, statistics, slice sampling, acquisition context, geometry/provenance, thresholds, interpretation caveats, optional local calibration, and disclaimer.
The report builder intentionally omits Patient Name, Patient ID, date of birth, original DICOM Pixel Data, and original DICOM files. Series descriptions and provenance values can still be indirect identifiers. Review and de-identify every file before sharing.
MEDICAL DISCLAIMER
Osteoporosis CT is intended for qualified healthcare professionals as an educational, research, and clinical decision-support tool. The app calculates attenuation statistics from a user-selected trabecular ROI in an imported CT series. It does not acquire CT images, validate examination adequacy, create an official radiology report, establish a diagnosis of osteoporosis or osteopenia, calculate a WHO DXA T-score, determine fracture probability, recommend medication, or provide surgical clearance.
HU thresholds are affected by scanner calibration, tube voltage, contrast phase, reconstruction kernel, slice thickness, vertebral level, artifacts, pathology, and ROI placement. Published thresholds are screening aids only and may not apply to an individual examination or local population. Every result must be independently checked on the original diagnostic images by a qualified clinician and interpreted with clinical risk factors, prior fractures, laboratory data, and locally validated bone-density testing.
Do not make or change a diagnosis or treatment solely from this app. Central DXA or validated QCT/phantomless QCT should be used when a definitive bone-density diagnosis, treatment decision, or longitudinal assessment is required. Patients and non-professional users should consult a physician before making any medical decision.
Imported DICOM data and generated reports may contain or derive from protected health information. Use only data you are authorised to process, follow institutional policy, verify recipients before sharing, and delete local data when no longer required.
REFERENCES
Pickhardt PJ, et al. Opportunistic screening for osteoporosis using abdominal computed tomography scans obtained for other indications. Ann Intern Med. 2013;158:588–595.
https://pubmed.ncbi.nlm.nih.gov/23588747/
Lenchik L, et al. Opportunistic screening for osteoporosis using computed tomography: state of the art and argument for paradigm shift. AJR Am J Roentgenol. 2018;210:1294–1301.
https://pubmed.ncbi.nlm.nih.gov/29570366/
Jang S, et al. Opportunistic osteoporosis screening at routine abdominal and thoracic CT: normative L1 trabecular attenuation values in more than 20,000 adults. Radiology. 2019;291:360–367.
https://pubmed.ncbi.nlm.nih.gov/30835188/
International Society for Clinical Densitometry — Official Positions.
https://iscd.org/learn/official-positions/
Support: info@orthopractis.com
Website: https://www.orthopractis.com
Privacy: https://www.orthopractis.com/privacy
Terms: https://www.orthopractis.com/terms-of-use


Osteoporosis CT: QCT and pQCT Quantification
The application measures the same transformable 3D region in axial, coronal, sagittal, and immersive views, then supports certificate-driven QCT/pQCT calibration, cross-system validation, quality control, and carefully bounded quantitative suggestions.
Workflow
Load and validate the DICOM series.Position, resize, and rotate the visible 3D ROI box.Select the exact phantom/scanner family.Enter certified reference values and acquisition metadata.Fit and inspect the calibration.Quantify the complete accepted voxel set.Review quality, extrapolation, and compatibility warnings.Export a traceable report.
Supported registry
Selection templates cover Mindways, QRM, Kyoto Kagaku, SCANCO, Stratec, Sun Nuclear/CIRS/Gammex QA objects, installed-base systems, custom certified phantoms, and no-physical-phantom workflows. The exact certificate and current manufacturer instructions always override the template.
When no phantom is available
The default output remains Hounsfield units. Optional air-offset and adipose/muscle normalization are labeled as approximate. They are not reported as mg HA/cm³ unless a separately validated local density model is selected.
Clinical boundary
For professional use only. This is an adjunct quantitative and research-support tool. It is not a stand-alone diagnosis, DXA replacement, treatment recommendation, or fracture-probability calculator.
Osteoporosis CT: QCT and pQCT Quantification
The application measures the same transformable 3D region in axial, coronal, sagittal, and immersive views, then supports certificate-driven QCT/pQCT calibration, cross-system validation, quality control, and carefully bounded quantitative suggestions.
Workflow
Load and validate the DICOM series.Position, resize, and rotate the visible 3D ROI box.Select the exact phantom/scanner family.Enter certified reference values and acquisition metadata.Fit and inspect the calibration.Quantify the complete accepted voxel set.Review quality, extrapolation, and compatibility warnings.Export a traceable report.
Supported registry
Selection templates cover Mindways, QRM, Kyoto Kagaku, SCANCO, Stratec, Sun Nuclear/CIRS/Gammex QA objects, installed-base systems, custom certified phantoms, and no-physical-phantom workflows. The exact certificate and current manufacturer instructions always override the template.
When no phantom is available
The default output remains Hounsfield units. Optional air-offset and adipose/muscle normalization are labeled as approximate. They are not reported as mg HA/cm³ unless a separately validated local density model is selected.
Clinical boundary
For professional use only. This is an adjunct quantitative and research-support tool. It is not a stand-alone diagnosis, DXA replacement, treatment recommendation, or fracture-probability calculator.
This registry is a practical selection layer for current, installed-base, legacy, QA-only, and custom calibration families. It is not a claim that every catalog item is currently sold in every country, and it does not replace the current manufacturer manual, software license, certificate, service bulletin, or regulatory labeling. The exact physical object's certificate controls insert composition, nominal values, tolerance, serial/lot, usable range, positioning, maintenance, and uncertainty.
## Included manufacturer families
- Mindways Software: QCT Pro Model 3, Model 4/asynchronous, and QA/asynchronous families.
- QRM GmbH: BDC/3, BDC/6, European Spine Phantom family, and micro-CT HA family.
- Kyoto Kagaku: B-MAS 200 family.
- SCANCO Medical: multi-reference HA and XtremeCT/XtremeCT II density/QA families.
- Stratec Medizintechnik: XCT 2000, XCT 3000, XCT Research SA+ calibration and QA families.
- Sun Nuclear/CIRS and Gammex: electron-density/tissue-characterization objects, explicitly restricted to CT-number/electron-density QA unless a separate mineral-density transfer study has been validated.
- Installed-base Cann-Genant/Image Analysis family.
- Custom certified mineral-equivalent phantom.
- No-physical-phantom HU and locally validated internal-reference workflows.
## Operating rule
1. Select manufacturer, family, model, modality, site, and use class.
2. Enter the exact insert values from the certificate; do not rely on example or remembered values.
3. Record scanner, model, kVp, reconstruction kernel, slice thickness, field of view, analysis software version, phantom serial/lot, and scan date.
4. Measure every insert using the manufacturer's placement and ROI method.
5. Inspect residuals, R², RMSE, range, and outliers.
6. Apply the equation only inside its validated scanner/protocol/site envelope.
7. For another scanner or protocol, perform cross-calibration rather than copying coefficients.
8. Keep axial QCT, pQCT, HR-pQCT, and micro-CT reference systems separate.
## Official starting points
- Mindways: https://www.mindways.com/
- QRM: https://www.qrm.de/en/products/
- SCANCO Medical: https://www.scanco.ch/
- Stratec Medizintechnik: https://www.stratec-med.com/
- Kyoto Kagaku: https://www.kyotokagaku.com/en/
- Sun Nuclear/CIRS: https://www.sunnuclear.com/products/advanced-electron-d
For professional use only. Osteoporosis CT provides adjunct quantitative information derived from user-selected image regions and user-supplied calibration/reference data. It does not independently diagnose osteoporosis or another disease, does not generate a DXA T-score, does not determine treatment, and does not replace radiologist interpretation, validated densitometry, fracture-risk assessment, manufacturer instructions, local quality assurance, or clinical judgment. Calibration and reference values are valid only within their documented scanner, protocol, software, anatomical site, phantom, certificate, and validation envelope.
references
[1] DICOM Standard: information object definitions and data encoding
National Electrical Manufacturers Association. DICOM Standard, PS3.3 and PS3.5, current edition. Defines image geometry, Pixel Data,
rescale attributes, pixel padding and transfer-syntax semantics used by the importer. Source
[2] ISCD Official Adult Positions 2023
International Society for Clinical Densitometry. Official Adult Positions, updated 2023. Includes QCT/pQCT acquisition, device-specific
validation, reporting, opportunistic CT, calibration/stability and treatment-decision boundaries. Source
[3] ACR–SPR–SSR QCT BMD practice parameter
American College of Radiology, Society for Pediatric Radiology, and Society of Skeletal Radiology. ACR–SPR–SSR Practice Parameter for the Performance of Quantitative Computed Tomography (QCT) Bone Mineral Density. Revised 2023. Source
[4] Opportunistic osteoporosis screening at abdominal CT Pickhardt PJ, Pooler BD, Lauder T, Muñoz del Rio A, Bruce RJ, Binkley N. Opportunistic screening for osteoporosis using abdominal computed tomography scans obtained for other indications. Ann Intern Med. 2013;158(8):588–595. doi:10.7326/0003-4819-158-8-201304160-00003. Source
[5] ISCD clinical use of QCT and pQCT
Engelke K, Adams JE, Armbrecht G, et al. Clinical use of quantitative computed tomography and peripheral quantitative computed
tomography in the management of osteoporosis in adults: the 2007 ISCD Official Positions. J Clin Densitom. 2008;11(1):123–162.
doi:10.1016/j.jocd.2007.12.010. Source
[6] European Spine Phantom standardization and cross-calibration
Kalender WA, Felsenberg D, Genant HK, Fischer M, Dequeker J, Reeve J. The European Spine Phantom—a tool for standardization and
quality control in spinal bone mineral measurements by DXA and QCT. Eur J Radiol. 1995;20(2):83–92. doi:10.1016/0720-048X(95)00631-Y.
Source
[7] Peripheral pQCT/DXA standardization phantom
Rüegsegger P, Kalender WA. A phantom for standardization and quality control in peripheral bone measurements by pQCT and DXA. Phys Med Biol. 1993;38(12):1963–1970. doi:10.1088/0031-9155/38/12/018. Source
[8] HR-pQCT imaging and reporting guidelines
Whittier DE, Boyd SK, Burghardt AJ, et al. Guidelines for the assessment of bone density and microarchitecture in vivo using
high-resolution peripheral quantitative computed tomography. Osteoporos Int. 2020;31(9):1607–1627. doi:10.1007/s00198-020-05438-5.
Source
[9] Multicenter HR-pQCT precision
Burghardt AJ, Pialat J-B, Kazakia GJ, et al. Multicenter precision of cortical and trabecular bone quality measures assessed by
high-resolution peripheral quantitative computed tomography. J Bone Miner Res. 2013;28(3):524–536. doi:10.1002/jbmr.1795. Source
[10] HU, BMD and compressive strength
Schreiber JJ, Anderson PA, Rosas HG, Buchholz AL, Au AG. Hounsfield units for assessing bone mineral density and strength: a tool for
osteoporosis management. J Bone Joint Surg Am. 2011;93(11):1057–1063. doi:10.2106/JBJS.J.00160. Source
[11] Agreement between clinical measurement methods
Bland JM, Altman DG. Statistical methods for assessing agreement between two methods of clinical measurement. Lancet.
1986;1(8476):307–310. doi:10.1016/S0140-6736(86)90837-8. Source